Verdict
SMC golden zone (Fibonacci)
By Thomas Jamais (Backtestd) · Published · Updated
Does SMC golden zone (Fibonacci) work?
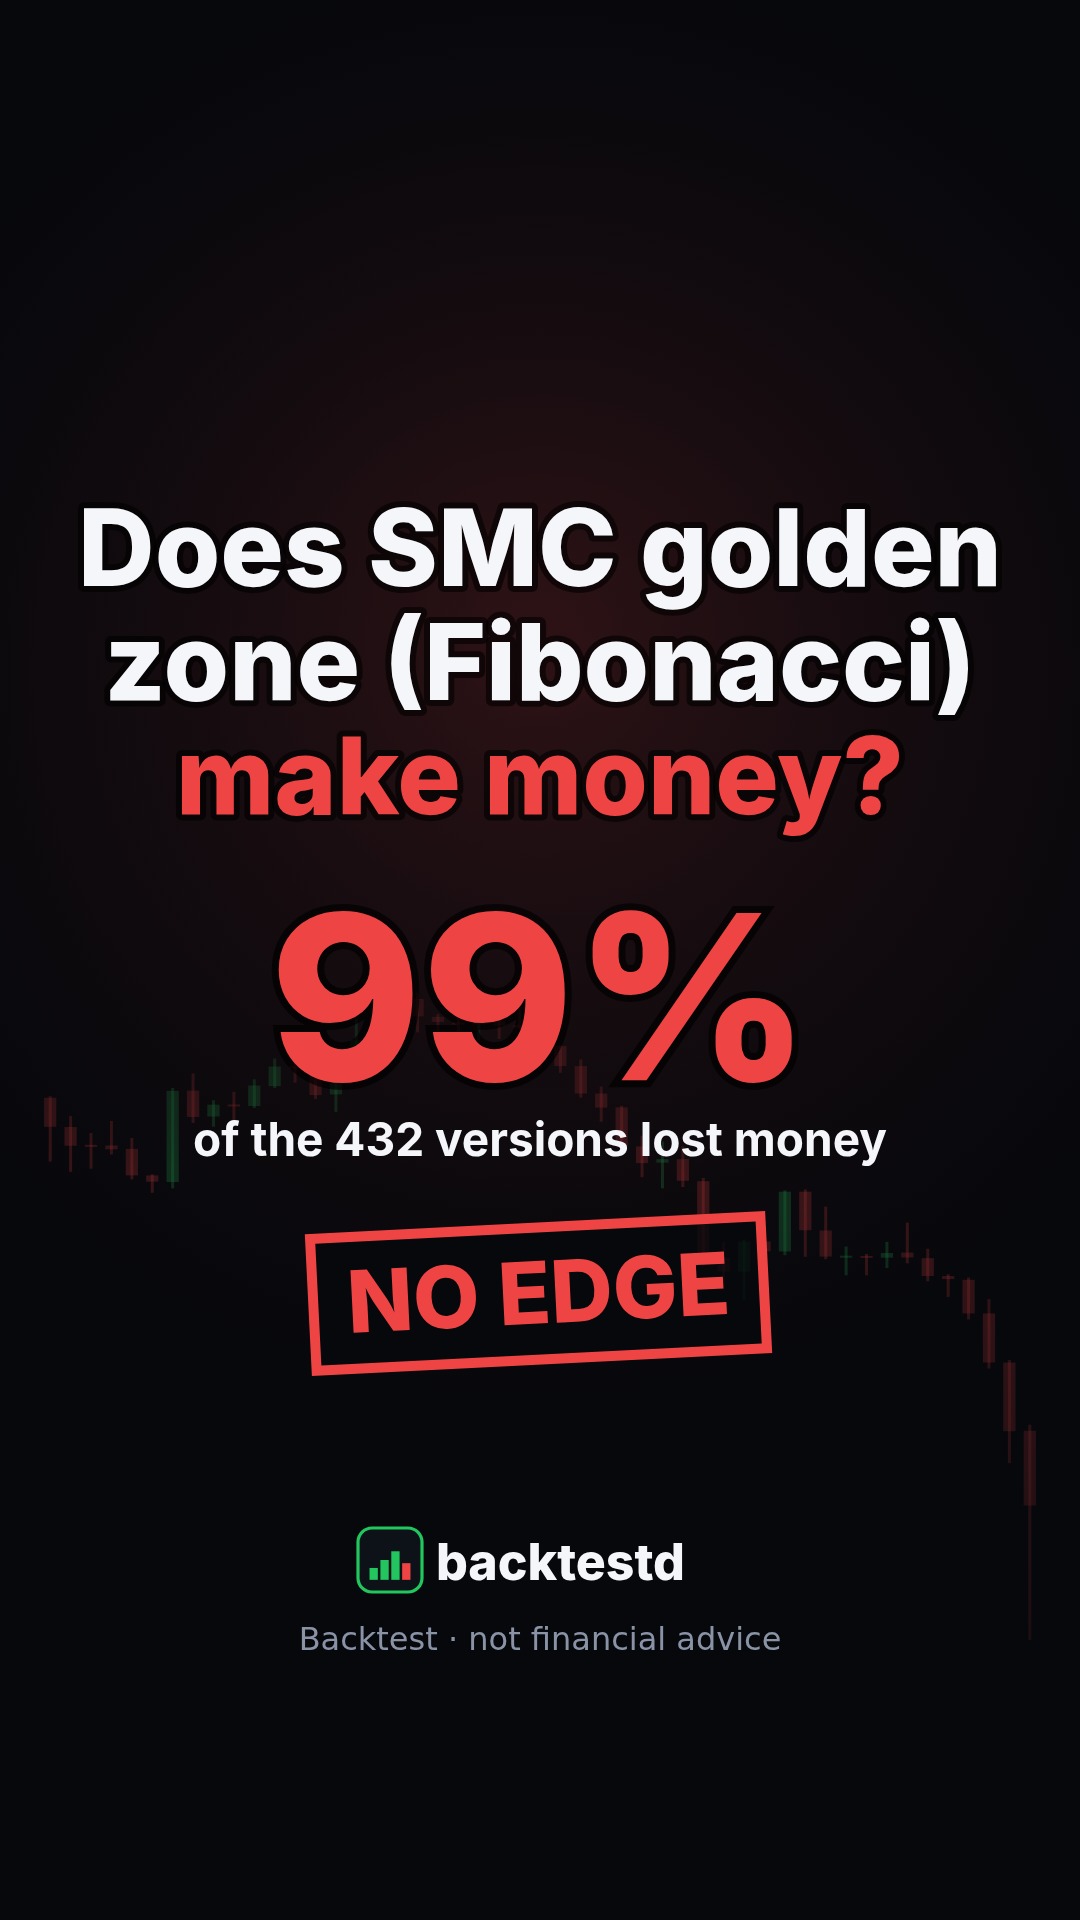
No, not in our test. We coded the rule, tested 432 versions of it on 42 markets from 2022 to 2025, fees, slippage and funding included. 100% of the versions lost money. The best version did not survive older data it had never seen (2020–2022).
Key facts
| Versions tested | 432 |
|---|---|
| Markets | 42 |
| Period | 2022-11-10 → 2025-07-09 |
| Candles | 15m |
| Costs | fees, slippage and funding on every trade |
| Versions that lost money | 100% |
| Verdict | No edge after costs |
Watch the videos
Short videos about this test. Each one has its own page.
 Videos
SMC golden zone (Fibonacci): we tested 432 versions →
 Part 1: the strategy explained
The SMC golden zone strategy (part 1) →
In short
We coded the rule, tested 432 versions of it on 42 markets from 2022 to 2025, fees, slippage and funding included. 100% of the versions lost money. The best version did not survive older data it had never seen (2020–2022).
The rule people share
As it is usually explained:
Explained: the terms
- First, a downtrend — This coin was falling. Lower highs, lower lows.
- CHoCH: the trend turns — Then price closes above the last high. Traders call it a change of character.
- BOS: it's confirmed — It breaks the next high too. A break of structure: the trend is now up.
- The golden zone — Draw a Fibonacci from the low to the new high. Between 50 and 61.8 percent: the golden zone.
- Buy, target 1.272 — Price comes back into the zone: buy. Stop just below it. Target: the 1.272 extension.
How we tested it
Data
15m candles of 42 markets (AAVE, ADA, APR, ARB, AVAX, BAT, BCH, BNB, BTC, BZ, CL, DOGE, DOOD, DOT, ENA, ETH, FIL, HYPE, INJ, IOST, LINK, LTC, NEAR, OKB, ONDO, PEPE, PUMP, QQQ, SOL, SPY, STRK, SUI, TAO, TIA, UNI, WLD, XAG, XAU, XPL, XRP), from 2022-11-10 to 2025-07-09. Crypto prices come from OKX perpetual futures; the 2020–2022 check uses Binance's public archive (median price gap to OKX: 0.06%). US index data comes from HistData.
Costs
Every trade pays a 0.05% taker fee per side, 2–5 basis points of slippage per side, and funding every 8 hours at each market's measured average rate. Results are in R: 1 R is the amount risked on one trade (entry to stop), so strategies with different stops compare fairly.
Versions
A rule shared online is never fully specified (which stop? which holding time? which timeframe?). So we test every reasonable reading: each combination of the settings below is one version.
Two halves
The data is split in two halves (a rising market, then a flatter one). A real edge should work in both.
Against the market
A long trade in a rising market makes money without any skill. We subtract what simply holding the crypto market (an equal-weight basket) on the same side over the same days would have made: what remains is what the rule adds.
Older data, never seen
The best version is then run, unchanged, on 2020–2022 data that played no part in choosing it (a crash, a bull market and a bear market).
Results
All 432 versions
Each bar counts versions by their average result per trade after costs (clipped to ±1 R). Green: made money; red: lost money.
The best of 432 versions
1053 trades, 22% winners, +0.005 R per trade on average, +5.0 R in total, worst drawdown −73.1 R.
Cumulative result after costs, trade after trade (dashed line: start of the second half).
- First half: −0.045 R per trade. Second half: +0.043 R per trade.
- Against holding the market over the same days: −0.014 R per trade (week-clustered t = −0.2).
- Same settings on 2020–2022: 758 trades, +0.159 R per trade, −0.008 R per trade against the market.
Why “the best version” misleads
With 432 versions, some look good by luck alone. The typical version made −0.170 R per trade; the best made +0.005. If the rule had no edge at all, the spread of results would look like this anyway: the best of many random tries always looks impressive. That is why we never trust the best version until it works on data it was not chosen on.
Verify it yourself
- Write the rule exactly (below: our specification and every setting we tried).
- Get free data: Binance's public archive (data.binance.vision) has years of candles; OKX and most exchanges offer an API.
- Include costs: fees on both sides, slippage, and funding for perpetual futures.
- Count results in R (risk per trade), not in %, and look at the typical version, not the best one.
- Split your data in two and keep a part you never look at until the end.
- Compare with simply holding the market over the same days.
Our exact specification (the lab's own words, in English)
SMC golden zone: after a change of character and a break of structure, buy the 50-61.8% Fibonacci pullback.

What it does: a downtrend turns (CHoCH: the first close above a swing high after a bearish break), then
confirms (BOS: the next close above a swing high). A Fibonacci is drawn from the reversal low to the
highest high since the BOS. The "golden zone" is the 50% to 61.8% retracement. Buy the first close in it,
stop just under the 61.8% line, target the 1.272 extension of the leg. Shorts mirror it.

Rules (fixed a priori, taken from the video's drawing, not tuned on results):
- Swings: two-sided fractals with pivot_len candles each side, known only pivot_len candles later
  (causal). A bullish break is the first close above the latest confirmed swing high, a bearish break
  the first close below the latest confirmed swing low (same as smc_structure_break / smc_ote_retrace).
- Long setup: a bullish break (BOS) whose previous break was bullish (the CHoCH) and the one before
  that bearish (need_choch = 1). need_choch = 0 accepts any bullish break (plain BOS).
- Fibonacci anchors: 1 = the lowest low since the last bearish break (the reversal low), fixed when the
  BOS happens. 0 = the highest high since the BOS (grows while the leg extends).
- Retracement at close i: r = (leg_high - close) / (leg_high - anchor_low). The first candle of the
  setup that closes at r >= 0.5 is the only try: it is a long if r <= zone_hi (inside the golden zone).
  A close that jumps past the zone skips the setup (a trader waiting for a close in the zone stays out).
  The setup ends at the next break on either side, or once a close goes below the anchor low.
- Stop: the zone_hi retracement level minus 0.25 x ATR(14) (just under the zone, as drawn).
- Target: anchor_low + target_ext x leg (1.272 = the extension drawn in the video). Time stop: hold_bars.
- Shorts: the mirror (bullish CHoCH -> bearish CHoCH, highest high since the last bullish break, ...).
- Legs smaller than one average daily range are skipped (micro structure on low timeframes).

Source: TikTok video "Smart Money Concept | #smc #fibonacci" by mralbash (2026-09-23), a silent chart
walkthrough: CHOCH, BOS, Fibonacci from the swing low to the BOS high, "GOLDEN ZONE + DEMAND" at 0.5-0.618,
ENTRY at 0.5, risk box under 0.618, TARGET box at the 1.272-1.472 extension. Idea only, no code copied.
Adaptations: the "demand" zone is not defined in the video; here the golden zone alone is the area.
Entry is the first close in the zone (our engine fills at the close) rather than a resting limit at 0.5.
The target is one fixed level (1.272) instead of a box. The video shows only a long; the short is the
mirror. How it differs from smc_ote_retrace: a shallower zone (50-61.8% vs 62-79%), a stop just under
the zone instead of at the leg origin (so a much bigger reward-to-risk), a CHoCH -> BOS sequence, and
the Fibonacci anchored at the reversal low.
Settings tried
| Setting | Values |
|---|---|
pivot_len | 3, 5, 8 |
zone_hi | 0.618, 0.705 |
need_choch | 0, 1 |
target_ext | 1.0, 1.272, 1.618 |
hold_bars | 120, 48, 480 |
timeframe | 15m, 1d, 1h, 4h |
Settings of the version shown
pivot_len | 8 |
zone_hi | 0.705 |
need_choch | 1 |
target_ext | 1.618 |
hold_bars | 120 |
timeframe | 15m |
Download every trade of the version shown (CSV, 1053 rows)
Limitations
- A backtest is not live trading: fills, outages and your own discipline differ.
- We test the rule as written; a trader's discretion is not testable.
- Markets change. A rule that failed here could work elsewhere, and the reverse.
- Costs depend on your exchange and size; ours are typical retail perpetual-futures costs.
Questions
Did you include fees?
Yes: fees, slippage and funding on every trade, from real exchange schedules.
Maybe it works on another timeframe?
We tested several timeframes and holding times: see “Settings tried”. The result does not depend on one choice.
Maybe it works with better risk management?
We tried stops of different widths, targets, trailing stops and partial exits. Risk management changes the shape of the results, not the sign of the edge.
Why should I trust you?
You should not: verify. The rule, every setting and every trade are on this page.
Does this mean nobody makes money with it?
Some traders will, by skill elsewhere or by luck. This test only says the rule itself does not give an edge after costs.
Disclaimer
Educational content based on historical backtests. Not financial advice. Past results do not predict future results. Trading leveraged products can lose more than you invest.
More tests
772 · No edge after costs→Moving-average trend following
1249 · Too weak to trade→New York open · 12 EMA on Nasdaq
28 · No edge after costs→