From zero #03 · Read a chart
What is a trend, really?
Watch the videos
Short videos about this test. Each one has its own page.
What you will learn
Define a trend with a rule (price vs its 50-day average) instead of a feeling.
What the episode says
Last time: short timeframes are mostly noise. So let's zoom out. Everyone says: trade with the trend. But what is a trend, exactly?
An uptrend looks like a staircase. Each high is above the last one. Each low is above the last one. Easy to see afterwards. Hard to use while it happens.
A rule is easier: the average closing price of the last 50 days. Price above it: we call the trend up. Below it: down. No feelings involved.
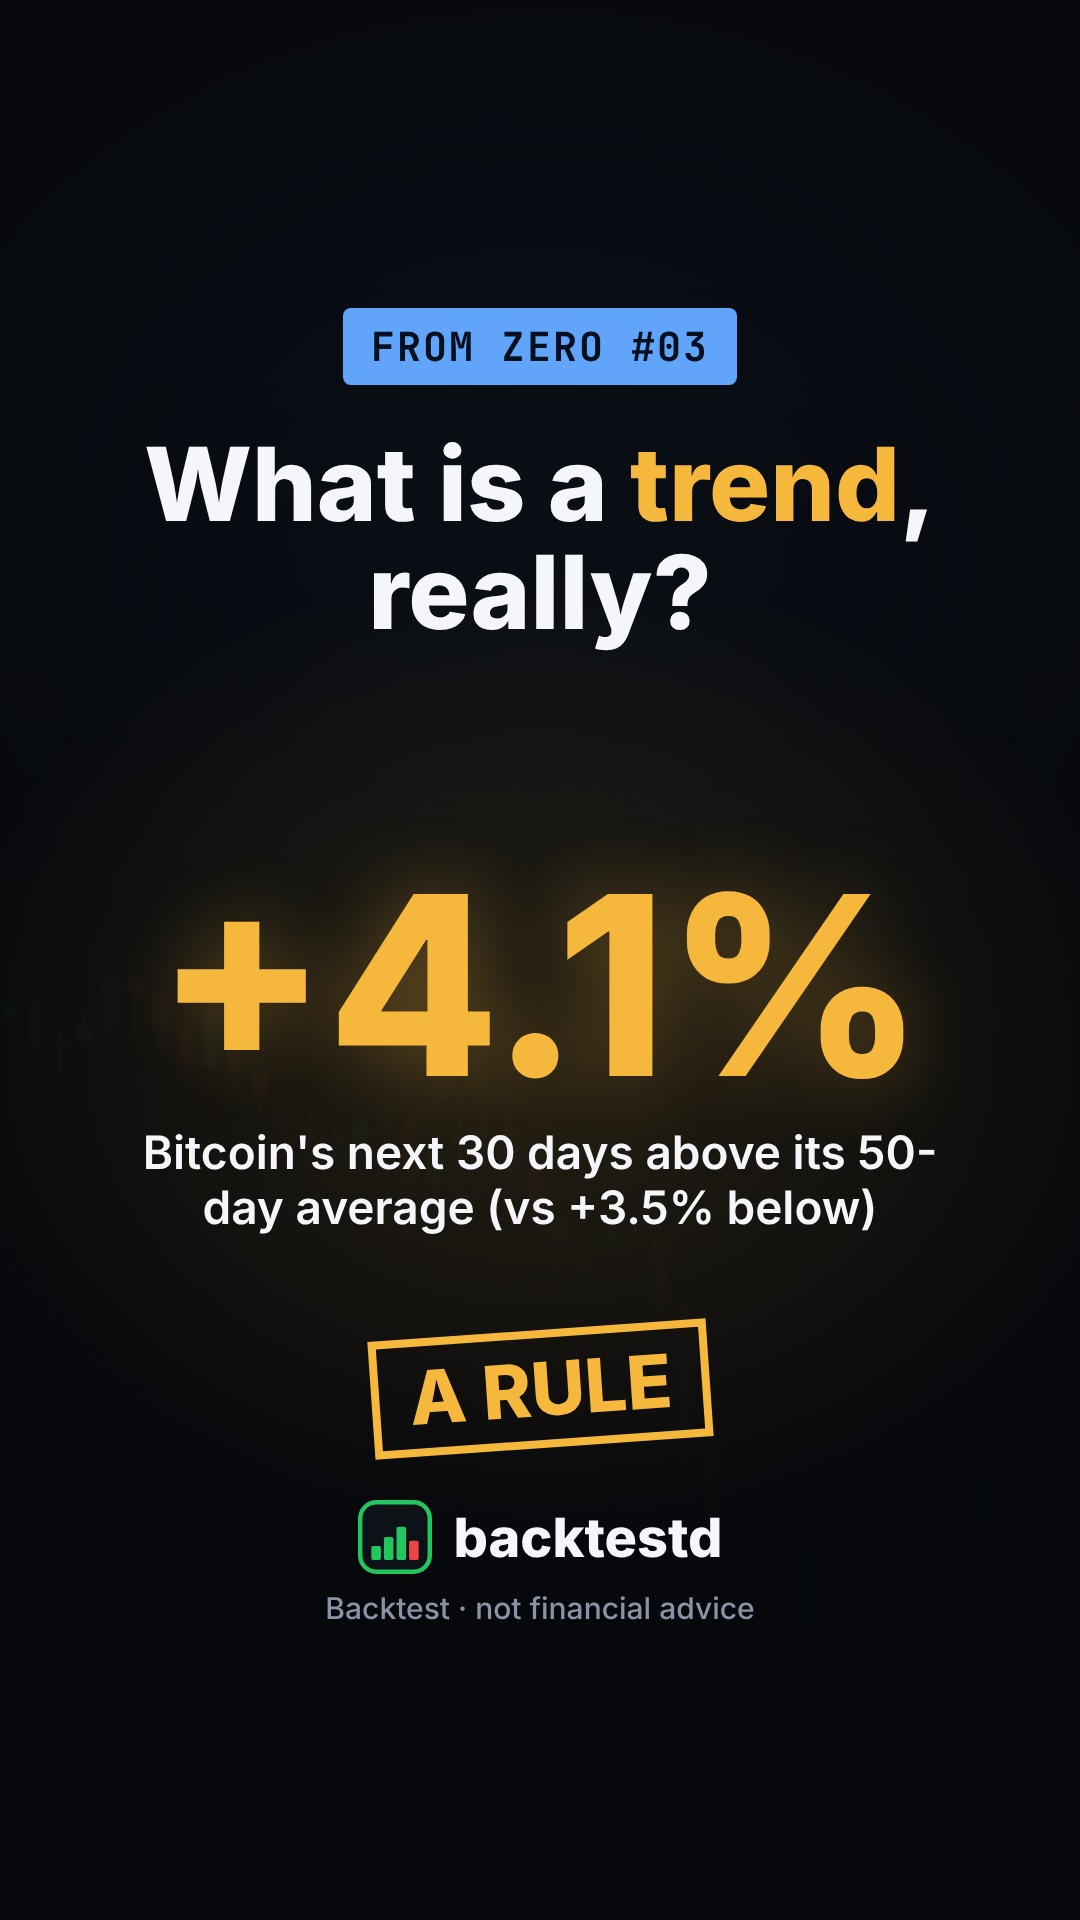
We checked 1,254 days of Bitcoin. Above the average, the next 30 days made 4.1% on average. Below it, 3.5%. Any day: 3.8%.
A trend is a rule you can test, not a feeling. And on Bitcoin, this one barely changed what came next. Next: support and resistance. Do those lines really hold?
Watch first: 01. What does one candle really tell you? · 02. Why does the same chart look calm in days and wild in 15 minutes?
Next episode: Do support and resistance hold?
Follow the tests: TikTok · Instagram · Contact
Education about how markets and tests work. Not financial advice.