From zero #01 · Read a chart
What does one candle really tell you?
Watch the videos
Short videos about this test. Each one has its own page.
What you will learn
Read open, close, high and low on any candle, and know that a candle's colour does not predict the next one.
What the episode says
Every chart is made of these. What does one candle really tell you? Let's read one, on real Bitcoin data.
This is one real day of Bitcoin. One candle is one day. The bottom of the body is where the day opened: 79,288 dollars. The top is where it closed: 81,060. It closed higher, so the candle is green. The thin lines are the wicks: the highest and the lowest price of the day. The next day closed below its open. That's a red candle.
Put the days side by side and you get the chart. Each candle is one day of buyers against sellers. Many traders read the colours. A green day, so tomorrow is green too?
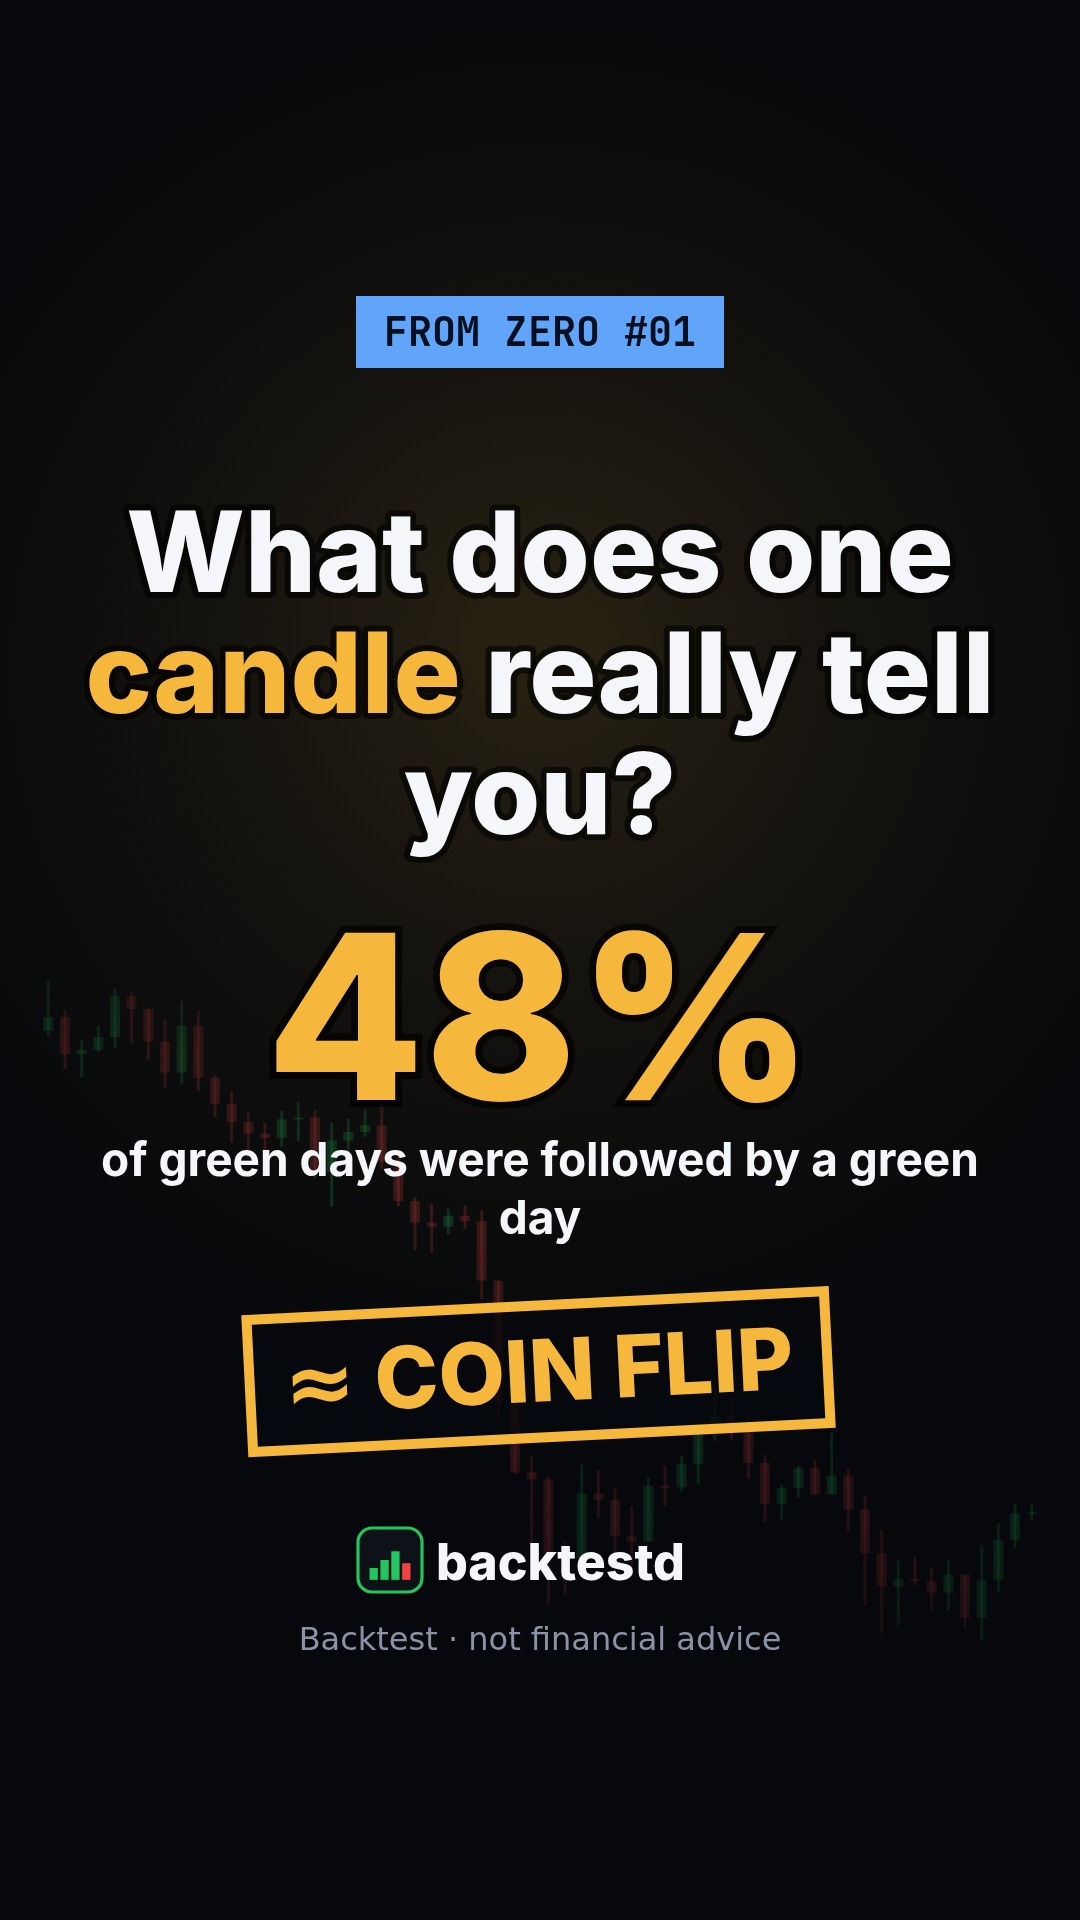
We checked 1,332 days of Bitcoin. After a green day, the next day was green 48% of the time. After a red day, 52%.
Close to a coin flip. One candle tells you what happened, not what happens next. Next episode: why the same chart looks calm on one day and wild on 15 minutes.
Next episode: Why does the same chart look calm in days and wild in 15 minutes?
Follow the tests: TikTok · Instagram · Contact
Education about how markets and tests work. Not financial advice.