From zero #02 · Read a chart
Why does the same chart look calm in days and wild in 15 minutes?
Watch the videos
Short videos about this test. Each one has its own page.
What you will learn
Know what a timeframe is, and that short timeframes are mostly noise smaller than the fees.
What the episode says
Last time: one candle is one day. But who decided it's a day? Why does the same chart look calm in days, and wild in 15 minutes?
Here is one day of Bitcoin: one candle. Cut the same day into hours: 24 candles. Into 15 minutes: 96 candles. Same prices, more detail. The time one candle covers is called the timeframe.
Now line up the 96 small candles by size. The amber band is what one trade costs: fees and slippage, in and out. 61 of these 96 candles fit inside it.
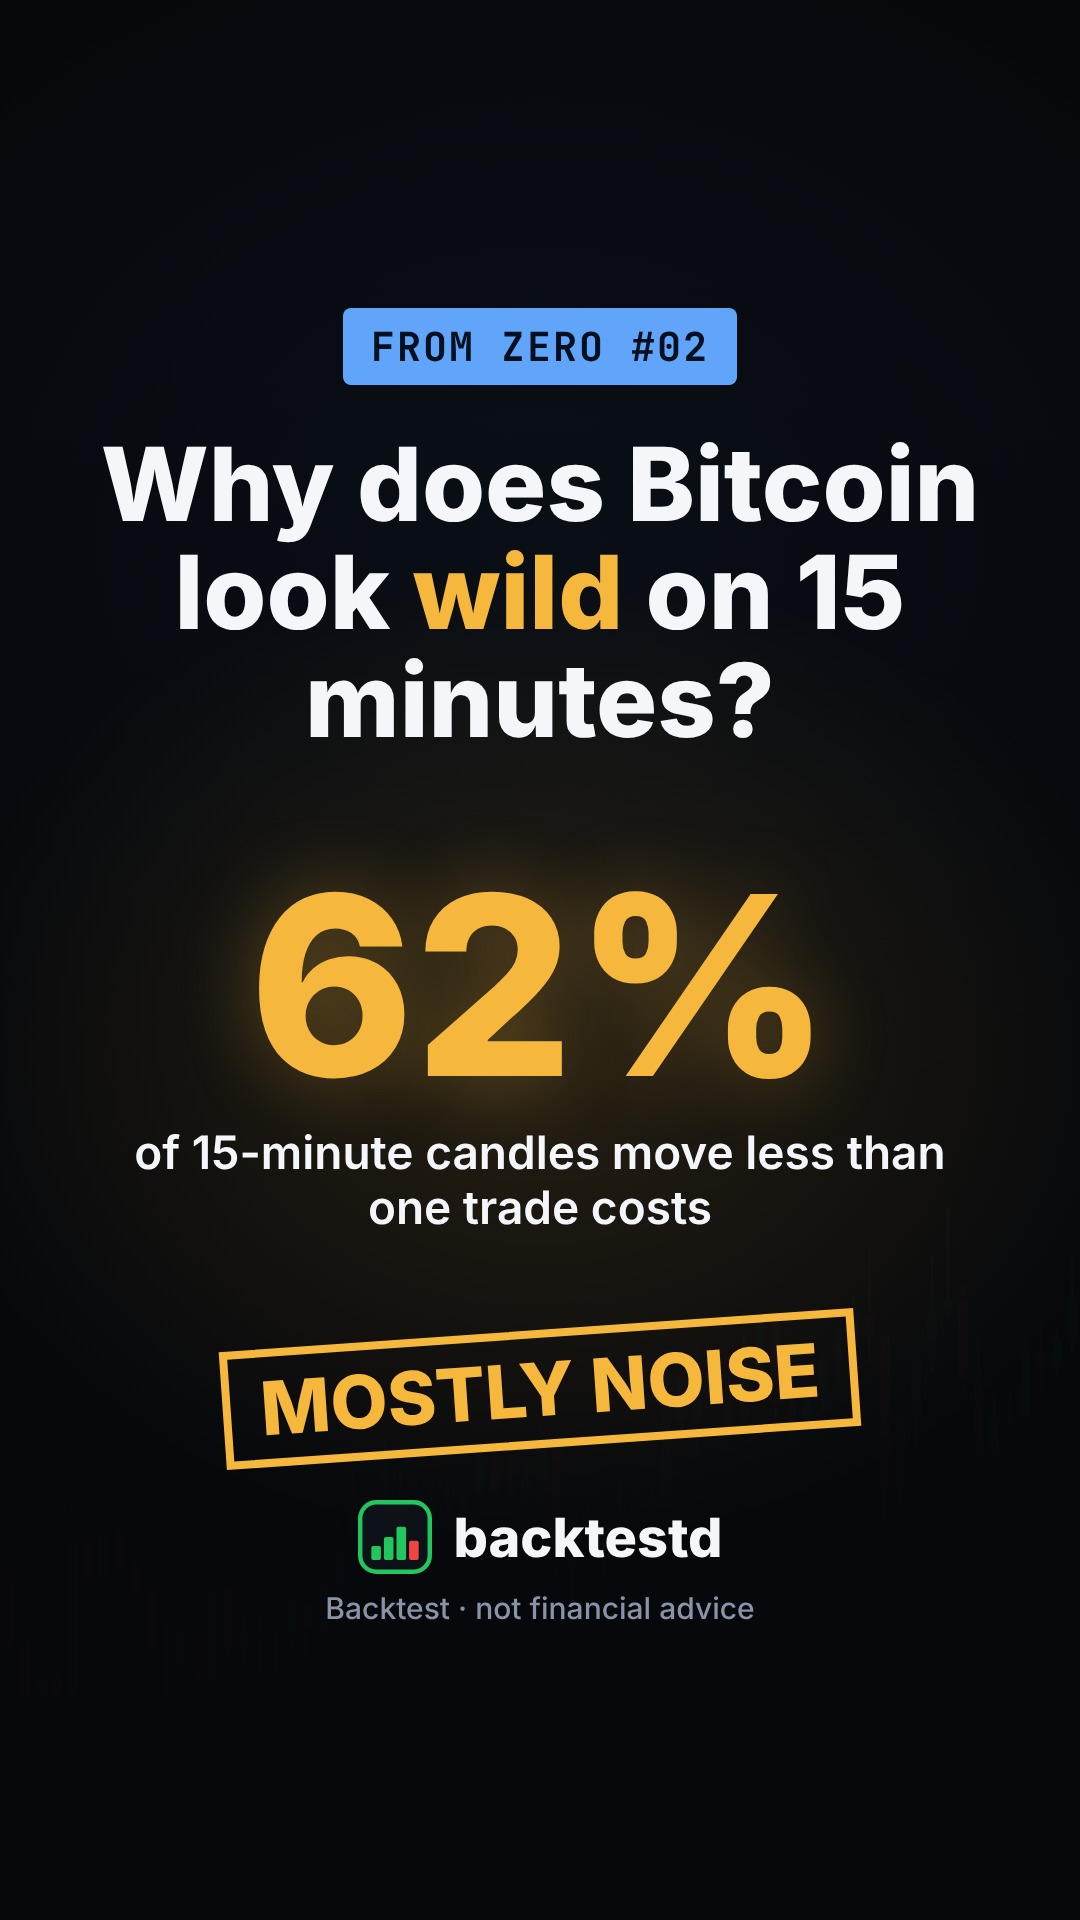
We measured 169,159 Bitcoin candles since 2022. On 15 minutes, 62% moved less than one trade costs. On one hour, 38%. On one day, only 9%.
Short timeframes are not wilder markets. They are tiny moves, often smaller than what a trade costs. That's called noise. Next: what is a trend, really?
Watch first: 01. What does one candle really tell you?
Next episode: What is a trend, really?
Follow the tests: TikTok · Instagram · Contact
Education about how markets and tests work. Not financial advice.